Project: Data analysis of developer job posts from Stack Overflow
View on GitHubThe main goal of this project is to extract interesting insights from developer job posts @ Stack Overflow.
dev-jobs-insights is a data mining project written in Python3 with the main objective of extracting meaningful insights from developer job posts. These insights can help us in getting a more accurate picture of what the developer job market looks like so we can make better decisions (e.g. what technologies to focus on to increase our chance of finding a job).
Data visualization is an important tool in interpreting data. Thus graphs and maps are an important aspect of this project so we can see the developer job market across different dimensions (e.g. salary, industries, locations).
Currently, the raw jobs data comes from Stack Overflow, but eventually other jobs sites will be integrated. The job posts data are mined from Stack Overflow's developer jobs RSS feed and website.
Contents
1. Sources of jobs data
1.1 Stack Overflow's RSS jobs feed
The first source of jobs data is the Stack Overflow's RSS jobs
feed which provides a total of 1000 entries (i.e. job posts). Almost every day, the feed gets updated with new
job posts. The Python feedparser module is used
for parsing the RSS feed which can also parse Atom feeds.
The most relevant attributes from each feed's entry are extracted such as the id, title,
published_parsed, tags, link, and location. The
id is actually the job post's id, and extra processing is performed on
published_parsed (of type time.struct_time) to convert the UTC
datetime to local time. The tags attribute is a list of names designating
skills (a.k.a. technologies) required for the given job post such as java, python, .net and agile.
These are the relevant attributes extracted from the feed into an SQLite database:
| Table | Attribute | Note |
|---|---|---|
| entries | job_post_id | this is the feed entry's id |
| title | job post's title | |
| author | company name | |
| url | link to the job post's webpage and useful for accessing the second source of jobs data |
|
| location | usually the city, region, and country are given | |
| summary | job post's summary | |
| published | datetime with format YYYY-MM-DDThh:mm:ssTZD where TZD is the time zone designator (+hh:mm or -hh:mm) |
|
| tags | name | name of the skills (a.k.a. technologies), e.g. python, .net |
1.2 Stack Overflow's developer jobs website
The second source of jobs data comes from Stack Overflow's developer jobs.
The entry's link from the RSS feed is used to get the corresponding job post's webpage. From the
webpage, we can get a lot more data about the job post that we couldn't get directly from the RSS feed such
as the job post salary, its industries, and the company size.
The Python module BeautifulSoup4 was
used for parsing the webpage HMTL and extracting the relevant data. The webpage is parsed in order by extracting
first the title, company name, job location, salary, roles, industries, and technologies. However, if some data
(e.g. author, location) was already present in the RSS feed's entry, the extraction is skipped for that
particular data.
All the extracted data from the RSS feed and webpages are stored in an SQLite database ready to be used for performing data analysis as explained in the section Data analyzers.
These are some of the relevant attributes extracted from each job post's webpage into an SQLite database:
| Table | Attribute | Note |
|---|---|---|
| companies | name | company name |
| url | company's URL | |
| description | company description containing HTML tags | |
| company_type | Private, Public, or VC Funded | |
| high_response_rate | whether the company responds quickly to job applications | |
| job_posts | job_post_id | this is the same as the entry's id from the RSS jobs feed |
| title | job post's title | |
| url | job post's URL | |
| job_post_description | job post's description | |
| date_posted | date the job post was posted | |
| valid_through | last day the job post is valid | |
| job_salaries | job_post_id | foreign key to link this salary to a job post |
| min_salary | maximum salary | |
| max_salary | maximum salary | |
| currency | salary's currency, e.g. USD, EUR | |
| conversion_time | datetime the min and max salaries were converted to the given currency |
|
| job_locations | job_post_id | foreign key to link this job location to a job post |
| city | ||
| region | a.k.a. state or province | |
| country | converted to the alpha2 code format |
2. Pipeline for generating the maps and graphs
The pipeline for ultimately generating the maps and graphs consists in a series of components that are run in this order:- RSS jobs reader
- input: RSS jobs feed
- output: SQLite database with all the relevant extracted data from the RSS feed
- Web scraper
- inputs:
- input1: SQLite database from the RSS jobs reader
- input2: job posts' webpages
- output: Scraped data from the job posts' webpages
- inputs:
- Data cleaner and loader
- input: Scraped data from the job posts' webpages
- output: SQLite database with all the job posts' scraped data
- Data analyzers
- input: SQLite database with the web scraped data
- output: maps, graphs, and reports
2.1 RSS jobs reader
The first stage in the pipeline is the RSS jobs reader which takes as input the Stack Overflow's RSS jobs feed. It is
built based on the Python module feedparser which does the parsing of the feed. The entries (one entry
= one job post) in the feed are extracted and loaded into an SQLite database, see Table 1
for a list of some of the attributes extracted.
Multiple Stack Overflow's RSS jobs feeds can be read but any entry that was already parsed will be skipped.
An interesting feature to implement in the future would be to use the updated
attribute to check if the entry was recently updated and if it is the case, update the entry's attributes in the
database.
2.2 Web scraper
The second stage in the pipeline is the web scraper which takes initially as input the SQLite database with
the parsed RSS feed from the previous stage. Each entry's url is used for getting the job post's
webpage which is parsed using the python module
BeautifulSoup4. The webpage is parsed in order by extracting relevant attributes from the
top to the bottom. Along the way, relevant attributes are extracted only if they were not already extracted from
the RSS feed. See Table 2 for a list of some of the attributes extracted from each job
post's webpage.
2.3 Data cleaner and loader
The third stage in the pipeline is the data cleaner and loader which takes as input the scraped data from the web scraper in the previous step. Before the scraped data is loaded into the database, the data is cleaned up by removing any non-informative job locations and renaming industries to standardized names.
2.3.1 Removing non-informative job locations
Some job posts have job locations that don't provide more information compared to their other job locations that they are already associated with. Thus, these non-informative locations are ignored to avoid artificially increasing the count of a particular job location. Here are the cases that are treated:
- A job post has two locations with the same country but one location only consists of the country while the other location consists of the country and another component (city and/or region). In this case, the location with only the country is ignored. Example, if a job post has the locations "Germany" and "Fulda, Germany", only the latter location is kept in order to avoid inflating the job location "Germany".
- Keep the location with the correct spelling. For example, if a job post has the locations "Hlavní msto Praha, CZ" and "Hlavní město Praha, CZ", only the latter location is kept.
- A job post has two locations with the same city and country except one has also a region. The location that provides all components (city, region, country) is kept. For example, if a job post has the locations "Toronto, CA" and "Toronto, ON, CA", only the latter location is kept.
2.3.2 Renaming industries
Some names of industries were almost identical that they were renamed to a standardized name:
| Similar names | Standard name chosen |
|---|---|
| 1. "Software Development / Engineering" 2. "Software Development" |
"Software Development" |
| 1. "eCommerce" 2. "Retail - eCommerce" 3. "E-Commerce" |
"E-Commerce" |
| 1. "Fashion" 2. "Fasion" [NOTE: typo from the job post] |
"Fashion" |
| 1. "Health Care" 2. "Healthcare" |
"Healthcare" |
2.4 Data analyzers
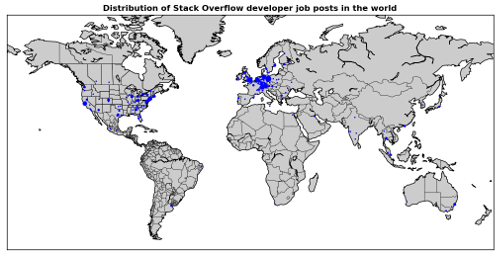
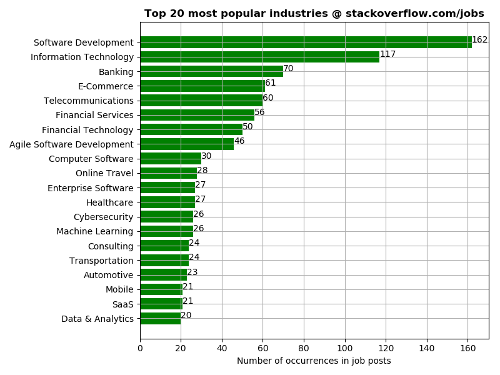
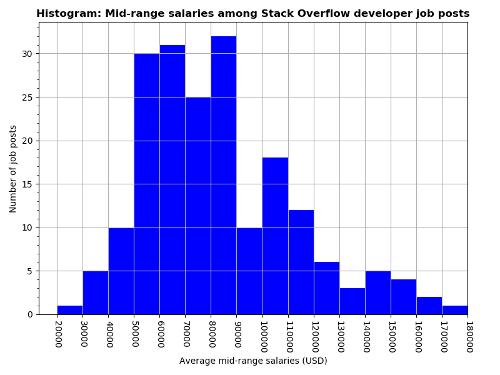
The fourth and last stage of the pipeline is the production of the different maps, graphs, and reports based on the cleaned scraped jobs data. Next is the list of the maps and graphs generated along with a sample figure (low-res) for each type of plot (see Insights: Maps and graphs if you want to see the full set of plots with higher resolution):
- Maps: distribution of job posts around the world where each dot on the map represents
a particular job location (or address) from job posts and the size of the dot gives the relative importance
of the job location compared to other job locations. Thus, a bigger dot for a particular location means that
more job posts are associated with this location compared to other locations having smaller dots.
- USA: distribution of job posts in the USA
- World: distribution of job posts around the World

Sample map; complete set of graphs @ Insights: Maps and graphs - Bar charts: top 20 most popular items (e.g. countries, industries or skills) based on the number of
occurrences mentioning the item in job posts
- Europe: top 20 most popular European countries
- USA: top 20 most popular US states
- World: top 20 most popular countries around the world
- Industries: top 20 most popular industries
- Job benefits: top 20 most popular job benefits
- Roles: top 20 most popular roles
- Skills: top 20 most popular skills (a.k.a. technologies)

Sample bar chart; complete set of graphs @ Insights: Maps and graphs - Histogram chart: mid-range salaries among Stack Overflow job posts.
Not all job posts mention a salary range (min and max salaries).

Sample histogram; complete set of graphs @ Insights: Maps and graphs - Scatter plots: interactive graphs built with the open-source graphing library
plot.ly. Each dot when clicked gives you the item's label (e.g. name of
industry or skill), the average mid-range salary and the number of job posts used for computing the average
mid-range salary of the given item.
- Europe: Average mid-range salaries vs number of job posts in Europe
- USA: Average mid-range salaries vs number of job posts in the USA
- World: Average mid-range salaries vs number of job posts around the World
- Industries: Average mid-range salaries vs number of job posts among industries
- Roles: Average mid-range salaries vs number of job posts among roles
- Skills: Average mid-range salaries vs number of job posts among skills (a.k.a technologies)

Sample scatter plot; complete set of graphs @ Insights: Maps and graphs
3. Mid-range salaries
The job salaries provided by the companies consist in a minimum and maximum values, e.g. €50k - 65k. Thus, in order to have one salary number per job post, I converted the range of salaries into a mid-range salary, e.g. €50k - 65k --> €57.5
Also, all salaries were converted to USD for better comparisons among salaries but you must be careful when doing these kinds of comparisons since some places (e.g. San Francisco or New York City) have high living costs than others so you will expect that these places will offer higher paying wages.
I used thresholds for ignoring suspicious values: everything outside the range [8000, 400000] (USD) was ignored. Some reasons might explain why these anomalous salaries appear such as forgetting putting 3 extra 0's (e.g. 10 instead of 10000), using originally the wrong currency, or simply the pay is not that good. I haven't implemented yet an automated method to decide which case each suspicious salary range falls into but I will do it eventually. For the moment there are very few ranges that get thrown away.
Average mid-range salariesThe average mid-range salary of an item (e.g. industries, skills) is computed by grouping all the same items along with their mid-range salaries and computing the average of their mid-range salaries.
4. TODOs
Tasks to complete in the short to medium term:
- Display jobs data summary directly on each map and graph
- Integrate more jobs data from Stack Overflow
- Generate map plots with plot.ly graphing library so the dots can be clicked on and be shown information such as the number of job posts and the min and max salaries for a particular job location
- Generate bar charts as subplots to group them in the same figure
- Enable interactive graphs for mobile devices; right now they don't show correctly at all on mobile devices
- Use a translating service to translate non-english countries (the most common case being German)
5. Roadmap
Tasks to complete in the long-term:
- Fully automate the whole pipeline of generating the graphs, maps, and reports
- Integrate more jobs data from other jobs sites
- Package the pipeline (except the Web scraper component) as a Docker container
- Use the whole pipeline for analyzing other kind of sites such as news and social network sites